-
Natural Gas (NATGAS/USD) Price Technical Analysis for January 25, 2024

Natural gas was trending lower on its hourly time frame, and price has just busted through the short-term descending trend line to signal that a reversal is in the works. Technical indicators are still pointing to more losses, though. The 100 SMA is below the 200 SMA to indicate that the path of least resistance is to the downside or that the selloff is more likely to gain traction than to reverse. Price is climbing above the 100 SMA, though, as an early indication of upside pressure. The 200 SMA might still hold as dynamic resistance around $2.600. Stochastic is indicating overbought conditions or exhaustion among ... (full story)
- Comments
- Subscribe
-
- Older Stories
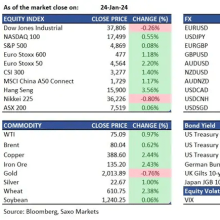
 From dallasfed.org|Jan 24, 2024
Natural gas liquids (NGLs) production increased in 2023, and exports grew to new heights. U.S. chemical production improved in 2023, helped by easing input costs. The ...
 From youtube.com/markets|Jan 24, 2024|2 comments
China said it will cut the reserve requirement ratio for banks within two weeks and hinted at more support measures to come, as Beijing looks to shore up the economy and halt a $6 ...
 From home.saxo|Jan 24, 2024
The Hang Seng Index surged by 3.6%, and the CSI300 Index rose by 1.4% following the People's Bank of China's 50bp cut in the reserve requirement ratio (RRR). The Nasdaq 100 ...
-
- Newer Stories
 From youtube.com/schwabnetwork|Jan 24, 2024
We’re bearish short-term and bullish long-term on gold, notes David McAlvany. He discusses commodities in focus. He talks about how geopolitics factor into gold’s outlook. He goes ...
 From iraqinews.com|Jan 25, 2024
Russia’s dominance as India’s top oil supplier in January is at risk because of Iraq’s oil exports. Iraq’s oil exports to India reached 1.17 million barrels per day until January ...
 From channelnewsasia.com|Jan 25, 2024
Oil prices rose on Thursday after data showed U.S. crude stockpiles fell more than expected last week, while the Chinese central bank's cut in banks' reserve ratio reinforced ...
- Story Stats
- Posted: Jan 24, 2024 11:09pm
- Submitted by:Category: Technical AnalysisComments: 0 / Views: 178